A database can take some time to reach good performances, the time necessary to OS and database caches to load the necessary data from the hard disk drive. Here is an example with PostgreSQL, which outlines the long delay incurred (18 minutes), presents a simple model to explain this behavior, and shows how to reduce it significantly (to a few minutes),
Create a test database
First, let us create a sample 1.5 GB test database with pgbench on a laptop (dual-core, 4 GB memory, 7200 rpm HDD 87MB/s sequential reads, much slower random reads, with PostgreSQL 9.2.4).createdb bench
pgbench -i --foreign-keys --scale=100 bench
This takes about 73 seconds for the copy, and 125 seconds with vacuum and foreign key declarations.SELECT pg_size_pretty(pg_database_size('bench')); -- 1502 MB
The database size is 1502 MB (192,256 PostgreSQL 8 KB pages), and the largest table is 1281 MB (163,968 pages), its index 214 MB (27,392 pages).
Before proceeding, cleanup memory caches by restarting postgresql and emptying the system file cache: /etc/init.d/postgresql restart
sync ; echo 3 > /proc/sys/vm/drop_caches
Run a read-only bench
Let us now run simple read-only transactions for 20 minutes, with a progress report every 10 seconds, using pgbench from current so as to benefit from the new --progress option, and some more instrumentation with a patch submitted to the next commitfest:pgbench --select-only --progress=10 --time=1200 bench > run.out 2>&1
The outpout in run.out looks like that:
progress: 10.0 s, 33.4 tps, 29.882 +- 18.185 ms lat
progress: 20.0 s, 35.3 tps, 28.359 +- 10.714 ms lat
progress: 30.0 s, 34.9 tps, 28.645 +- 9.640 ms lat
[...]
progress: 1190.0 s, 4614.8 tps, 0.214 +- 0.040 ms lat
progress: 1200.0 s, 4555.2 tps, 0.217 +- 0.068 ms lat
The good news is that the database will eventually be held fully in memory, so that SELECT transactions will not require slow disk accesses in the end. The bad news is that it takes some time to reach the steady state. Here is the tps plot:
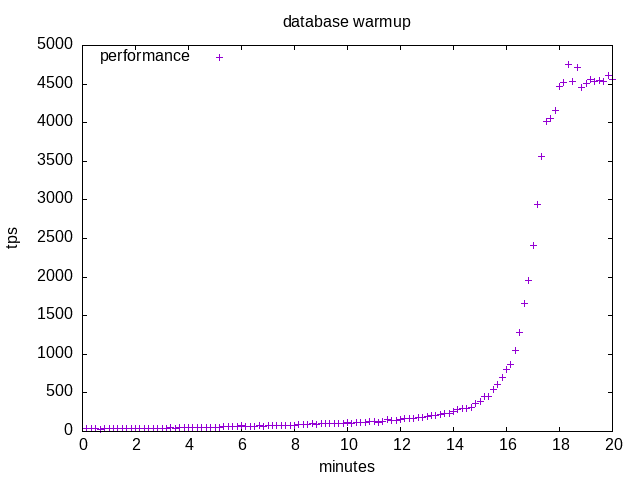
I just have to wait for 18 minutes of random disk accesses which generate worrying crackling sounds, and it’s up… If more clients are connected in parallel, the time is reduced but the crackling sounds are just more intense.
What’s happening?
These transactions from pgbench perform a random primary-key select in the large pgbench_accounts table. The plan uses an index to find tuple pages, and then fetches the data.
At the beginning of the run the OS file cache and PostgreSQL page cache are empty, so index and table pages are fetched from the disk and the performance is disk I/O bound starting from around 33 tps (30 ms/t).
At the end of the run, all pages are in memory, there are no more disk accesses and the performance is CPU bound at around 4500 tps (0.22 ms/t).
In between there is a gradual transition from disk accesses to cache hits which takes 18 minutes. At the beginning, the probability of a cache hit is null. The more transactions are processed, the more pages are loaded, and the probability of a cache hit slowly increases. The slow performance state is quite long because for a long time most transactions are out of cache and slow disk accesses are required. There is a then a quick transition to the fast performance state when many pages are available, so that there are stretches of cache hits between cache misses which result in a fast growing tps. When most pages are loaded, the rate of new fetched pages slows down as it becomes rare to require an out-of-cache page.
At 7200 rpm, the disk provides maybe 200 sequential random reads per seconds (add a small seek time if fragmentation is low to half rotation latency), thus reading the full database requires about 15 minutes.
How to improve this behavior?
The issue is that the database uses random disk accesses to fetch its data, thus it takes some time to fill the cache and start benefiting from cache hits. This effect is especially dramatic when the steady state is cpu bound.
You can help the database cache by executing a query which will perform a sequantial scan of the whole table, for instance this query runs in about 2 to 3 minutes and will load the table pages:SELECT AVG(abalance) FROM pgbench_accounts;
However, the index pages are not loaded by the scan, and you will have to wait.
Alternatively, you can help the system file cache by reading the files, something not very clean (we should look for the needed files) like the following takes less that 30 seconds:cat /var/lib/postgresql/9.2/main/base/*/* > /dev/null
The result is that at the end of the SQL or shell command the performances are on the upper side after about 3 minutes:
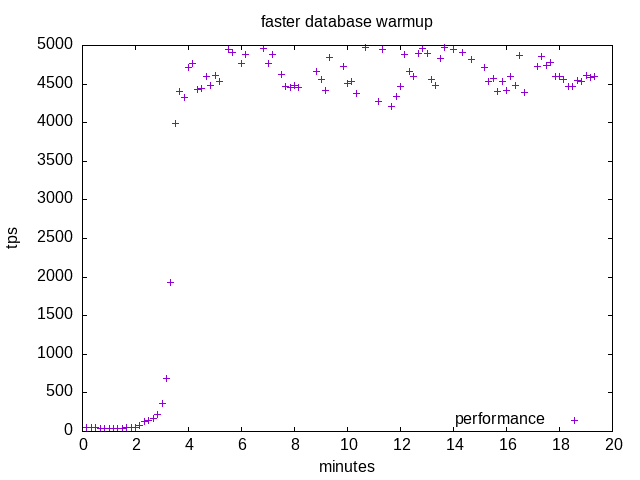
Preloading data will work perfectly well for read-only transaction if data fit in memory. Otherwise it will help the database to reach more quickly its performance steady state with a mix of in memory cache hits and much slower disk accesses.
Some modelling
Let us build a little model to explain the warm-up behavior.
Let P be the total number of pages, p(i) the probability of a page to be available for transaction i, with p(0) = 0 as no pages are loaded at the beginning. Then on average: \[p(i+1) = p(i) + \frac{1-p(i)}{P}\]
If we have a cache miss (probability 1-p(i)), a new page is loaded which increase the ratio of in memory pages by 1/P. Probability p(i) increases from 0 to 1 as transactions are processed.
The above equation can be seen as an autonomous (ordinary) differential equation: \[\frac{p(i+1) - p(i)}{1} = \frac{\partial p}{\partial i} = \frac{1 - p}{P}\]
The solution of which is something like: \[p(i) = 1 - e^{-\frac{i}{P}}\]
Transaction duration d(i) is either \(T_d\) (large) for hard disk accesses, or \(T_c\) (small) for cache hits, weighted with their respective probability: \[d(i) = T_d (1 - p(i)) + T_c p(i) = (T_d - T_c) e^{-\frac{i}{P}} + T_c\]
As \(p(i)\) goes from \(0\) to \(1\), the transaction delay goes from \(T_d\) down to \(T_c\). The performance is \(\mbox{tps}(i) = \frac{1}{d(i)}\).
The time of transaction \(i\) is obtained by integrating \(d(i)\) and assuming \(t(0) = 0\): \[t(i) = \int_{0}^{i} (T_d - T_c) e^{-\frac{j}{P}} + T_c \mathrm{d}j\]
Thus: \[t(i) = T_c i + P (T_d - T_c) (1 - e^{-\frac{i}{P}})\]
The result with 191,360 pages, 4.7 ms (low seek time assumed) disk random read accesses, 0.22 ms cpu per transaction, with tics every 100,000 transactions, is plotted as the red curve \((t(i),\mbox{tps}(i))\):
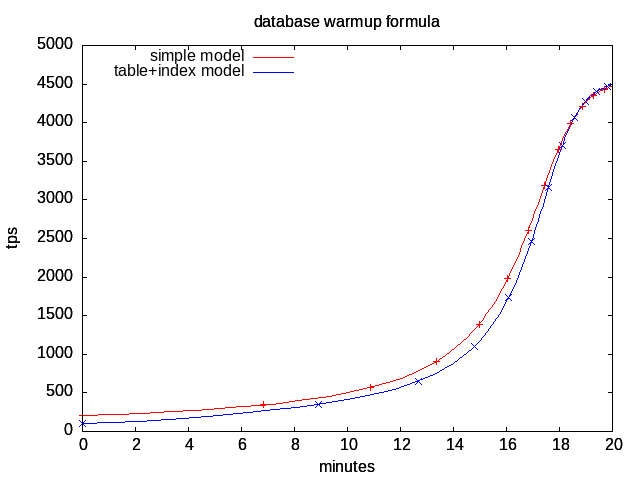
The comparison with measurements is quite good, the general behavior is explained based on the number of pages, disk rotation speed and cpu load.
The performance is over estimated at the beginning because index pages must be loaded in addition to the target table page, which is not taken into account by the model. The blue curve takes this effect into account by separating table and index pages (163,968+27,392) in two cumulated formulas, and shows a steeper slope, closer to the measured one.
By computing the zero of the second derivative of tps(i), we can figure out when the maximum tps variation occurs, which is when \(e^{-\frac{i}{n}} = \frac{T_c}{(T_d - T_c)}\), that is \(i = n \,\ln \frac{T_d-T_c}{T_c}\). For the simple model, this is around transaction 586,000 after about 16 mn, with 95.3% of data in cache.
Conclusion
Warming-up a database for good cache behavior can really take a long time with pretty low performance. You must take that into account when running a benchmark. A rough estimate of the warmup time is to count how many pages must be loaded multiplied by the time to read a random page from the disk. Some ability to hint PostgreSQL about preloading index and table pages would be nice. Otherwise, resort to the above manual methods, or be patient!
Links
Gnuplot scripts for slow, fast and formula images. Raw progress data from slow and fast runs.
See also benchmark discussion started by Stefan Keller, pg_prewarm patch by Robert Haas, pgfincore project by Cédric Villemain, blog post about PostgreSQL caching by Raghavendra.