Data Loading Performance of Postgres and TimescaleDB
Postgres is the leading feature-full independent open-source relational database, steadily increasing its popularity over the past 5 years. TimescaleDB is a clever extension to Postgres which implements time-series related features, including under the hood automatic partioning, and more.
Because he knows how I like investigate Postgres (among other things) performance, Simon Riggs (2ndQuadrant) prompted me to look at the performance of loading a lot of data into Postgres and TimescaleDB, so as to understand somehow the degraded performance reported in their TimescaleDB vs Postgres comparison. Simon provided support, including provisioning 2 AWS VMs for a few days each.
Summary
The short summary for the result-oriented enthousiast is that for the virtual hardware (AWS r5.2xl and c5.xl) and software (Pg 11.[23] and 12dev, TsDB 1.2.2 and 1.3.0) investigated, the performance of loading up to 4 billion rows in standard and partioned tables is great, with Postgres leading as it does not have the overhead of managing dynamic partitions and has a smaller storage footprint to manage. A typical loading speed figure on the c5.xl VM with 5 data per row is over 320 Krows/s for Postgres and 225 Krows/s for TimescaleDB. We are talking about bites of 100 GB ingested per hour.
The longer summary for the performance testing enthousiast is that such investigation is always much more tricky than it looks. Although you are always measuring something, what it is really is never that obvious because it depends on what actually limits the performance: the CPU spent on Postgres processes, the disk IO bandwidth or latency… or even the process of generating fake data. Moreover, performance on a VM with the underlying hardware systems shared between users tend to vary, so that it is hard to get definite and stable measures, with significant variation (about 16%) from one run to the next the norm.
Test Scenario
I basically reused the TimescaleDB scenario where many devices frequently send timespamped data points which are inserted by batch of 10,000 rows into a table with an index on the timestamp.
All scripts and program sources used for these tests are available on GitHub.
CREATE TABLE conditions(time TIMESTAMPTZ, dev_id INT, data1 FLOAT8, …, dataX FLOAT8);
CREATE INDEX conditions_time_idx ON conditions(time);
I used standard tables and tables partitioned per week or month. Although the initial scenario inserts \(X=10\) data per row, I used \(X=5\) for most tests so as to emphasize index and partioning overheads.
For filling the tables, three approaches have been used:
-
a dedicated perl script that outputs a
COPY, piped into psql: piping means that data generation and insertion work in parallel, but generation may possibly be too slow to saturate the system. -
a C program that does the same, although about 3.5 times faster.
-
a threaded load-balanced libpq C program which connects to the database and fills the target with a
COPY. Although generation and insertion are serialized in each thread, several connections run in parallel.
Performances
All in all I ran 140 over-a-billion row loadings: 17 in the r5.2xl AWS instance and 123 on the c5.xl instance; 112 runs loaded 1 billion rows, 4 runs loaded 2 billion rows and 24 runs loaded 4 billion rows.
First Tests on a R5.2XL Instance
The first serie of tests used a r5.2xl memory-optimized AWS instance (8 vCPU, 64 GiB) with a 500 GB EBS (Elastic Block Store) gp2 (General Purpose v2) SSD-based volume attached.
The rational for this choice, which will be proven totally wrong, was that the database loading would be limited by holding the table index in memory, because if it was spilled on disk the performance would suffer. I hoped to see the same performance degradation depicted in the TimescaleDB comparison when the index would reach the available memory size, and I wanted that not too soon.
The VM ran Ubuntu 18.04 with Postgres 11.2 and 12dev installed from
apt.postgresql.org and TimescaleDB 1.2.2 from
their ppa.
Postgres default configuration was tune thanks to timescaledb-tune, on which
I added a checkpoint_timeout:
shared_preload_libraries = 'timescaledb'
shared_buffers = 15906MB
effective_cache_size = 47718MB
maintenance_work_mem = 2047MB
work_mem = 40719kB
timescaledb.max_background_workers = 4
max_worker_processes = 15
max_parallel_workers_per_gather = 4
max_parallel_workers = 8
wal_buffers = 16MB
min_wal_size = 4GB
max_wal_size = 8GB
default_statistics_target = 500
random_page_cost = 1.1
checkpoint_completion_target = 0.9
max_connections = 50
max_locks_per_transaction = 512
effective_io_concurrency = 200
checkpoint_timeout = 1h
Then I started to load 1 to 4 billion rows with fill.pl ... | psql.
Although it means that the producer and consummer run on the same host thus can
interfere one with the other, I wanted to avoid running on two boxes and have
potential network bandwidth issues between these.
For 1 billion rows, the total size is 100 GB (79 GB table and 21 GB index) on Postgres with standard or partitioned (about 11 weeks filled) tables, and 114 GB for TimescaleDB. For 4 billion rows we reach 398 GB (315 GB table + 84 GB index over memory) for standard Postgres and 457 GB (315 GB table + 142 GB index) for TimescaleDB. TimescaleDB storage requires 15% more space, the addition being used for the index.
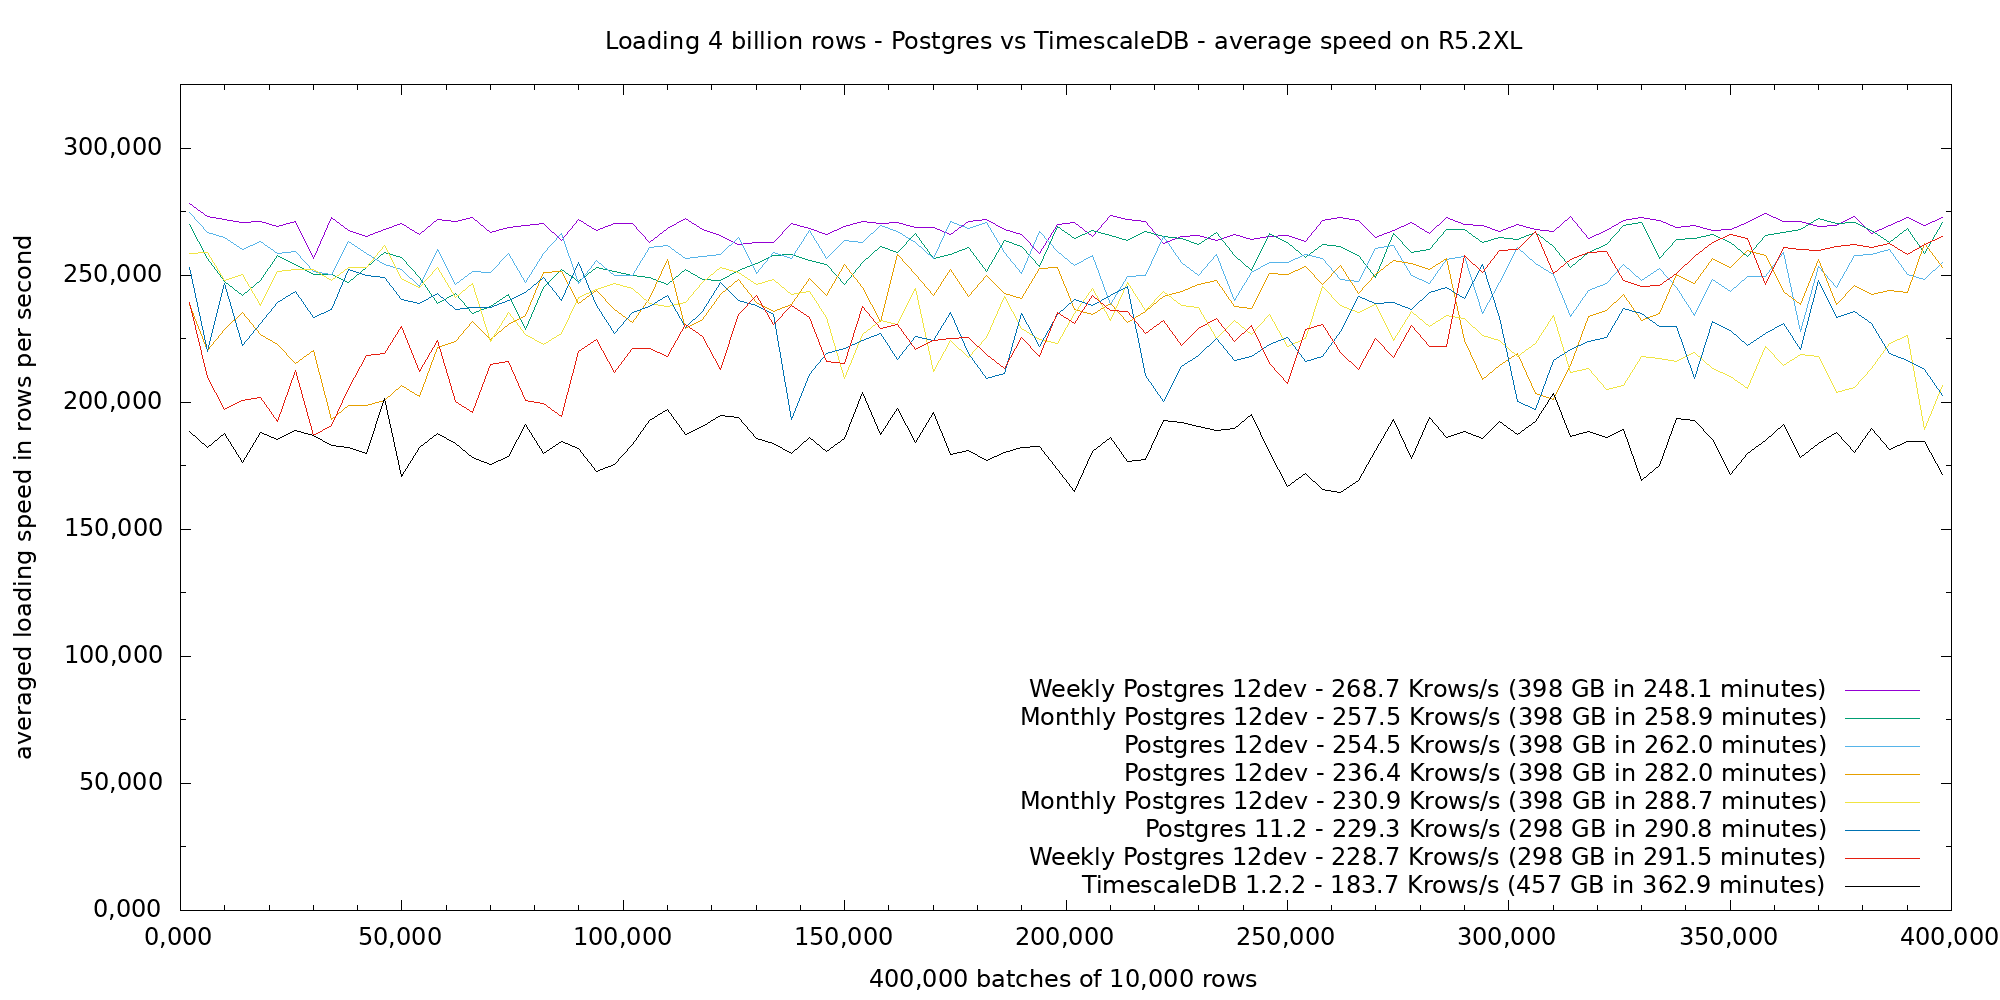
The next figure shows the average speed of loading 4 billion rows in 400,000 batches of 10,000 rows on the r5.2xl VM with the psql-piping approach. All Postgres (standard, weekly or monthly partitions) tests load between 228 and 268 Krows/s, let us say an average of 248 Krows/s, while TimescaleDB loads at 183 Krows/s. TimescaleDB loads performance is about 26% below Postgres, which shows no sign of heavily decreasing performance over time.
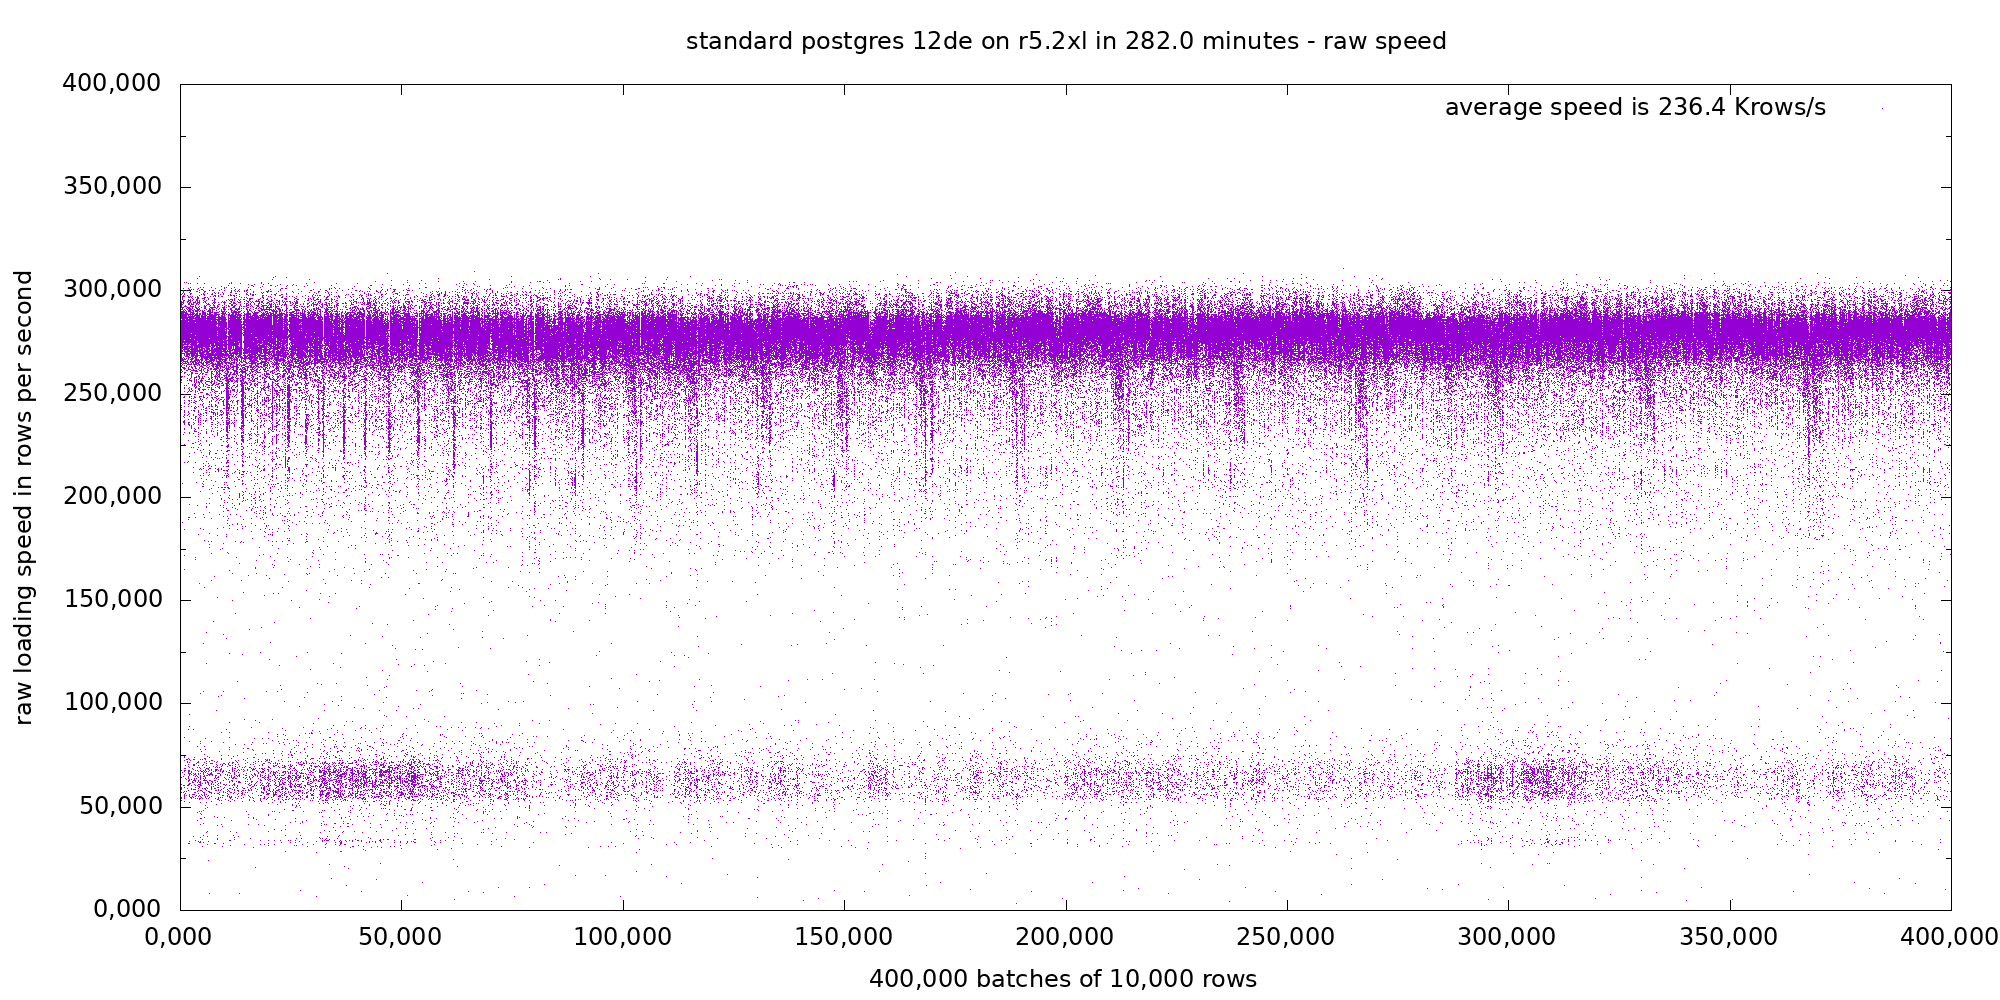
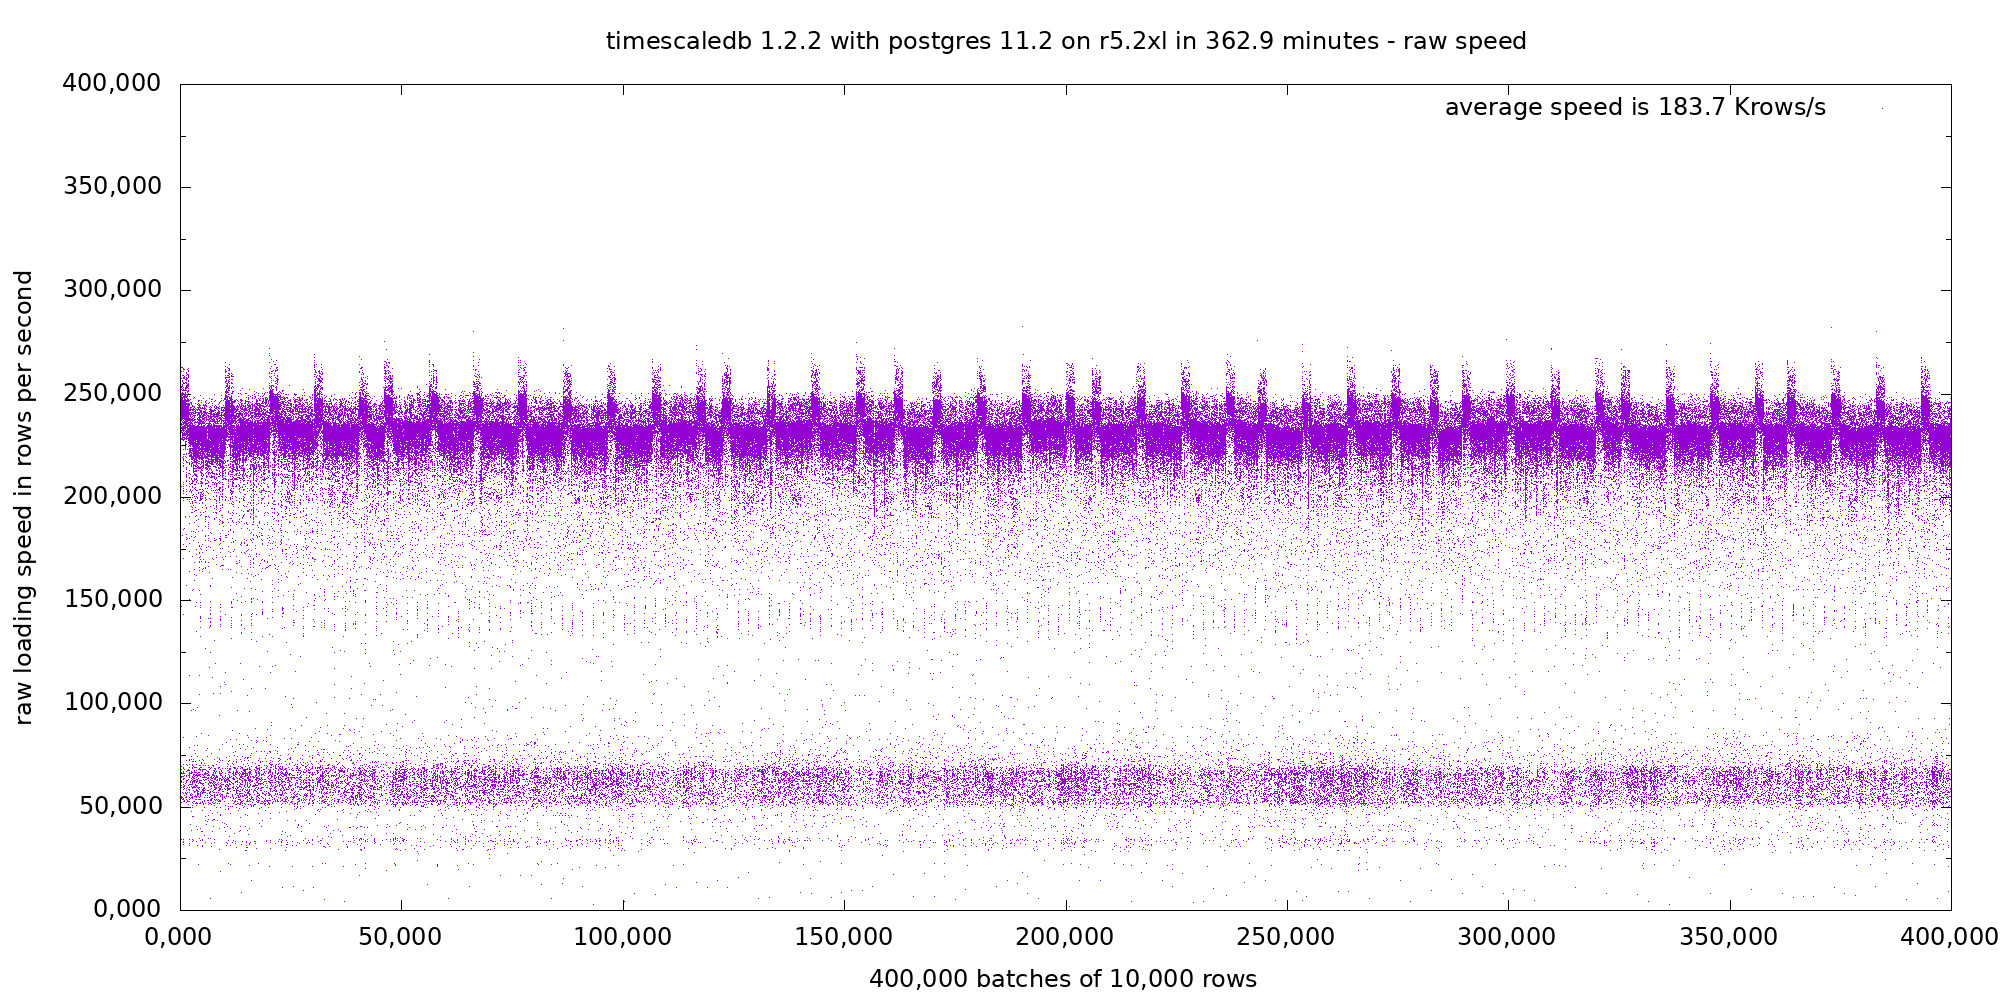
I could have left it at that, job done, round of applause. However, I like digging. Let us have a look at the detailed loading speed for the first Postgres 12dev standard tables run and for the TimescaleDB run.
In both runs we can see two main modes: One dense high speed mode with pseudo-periodic upward or downward spikes, and a second sparse low speed mode around 65 Krows/s. The average is between these two modes.
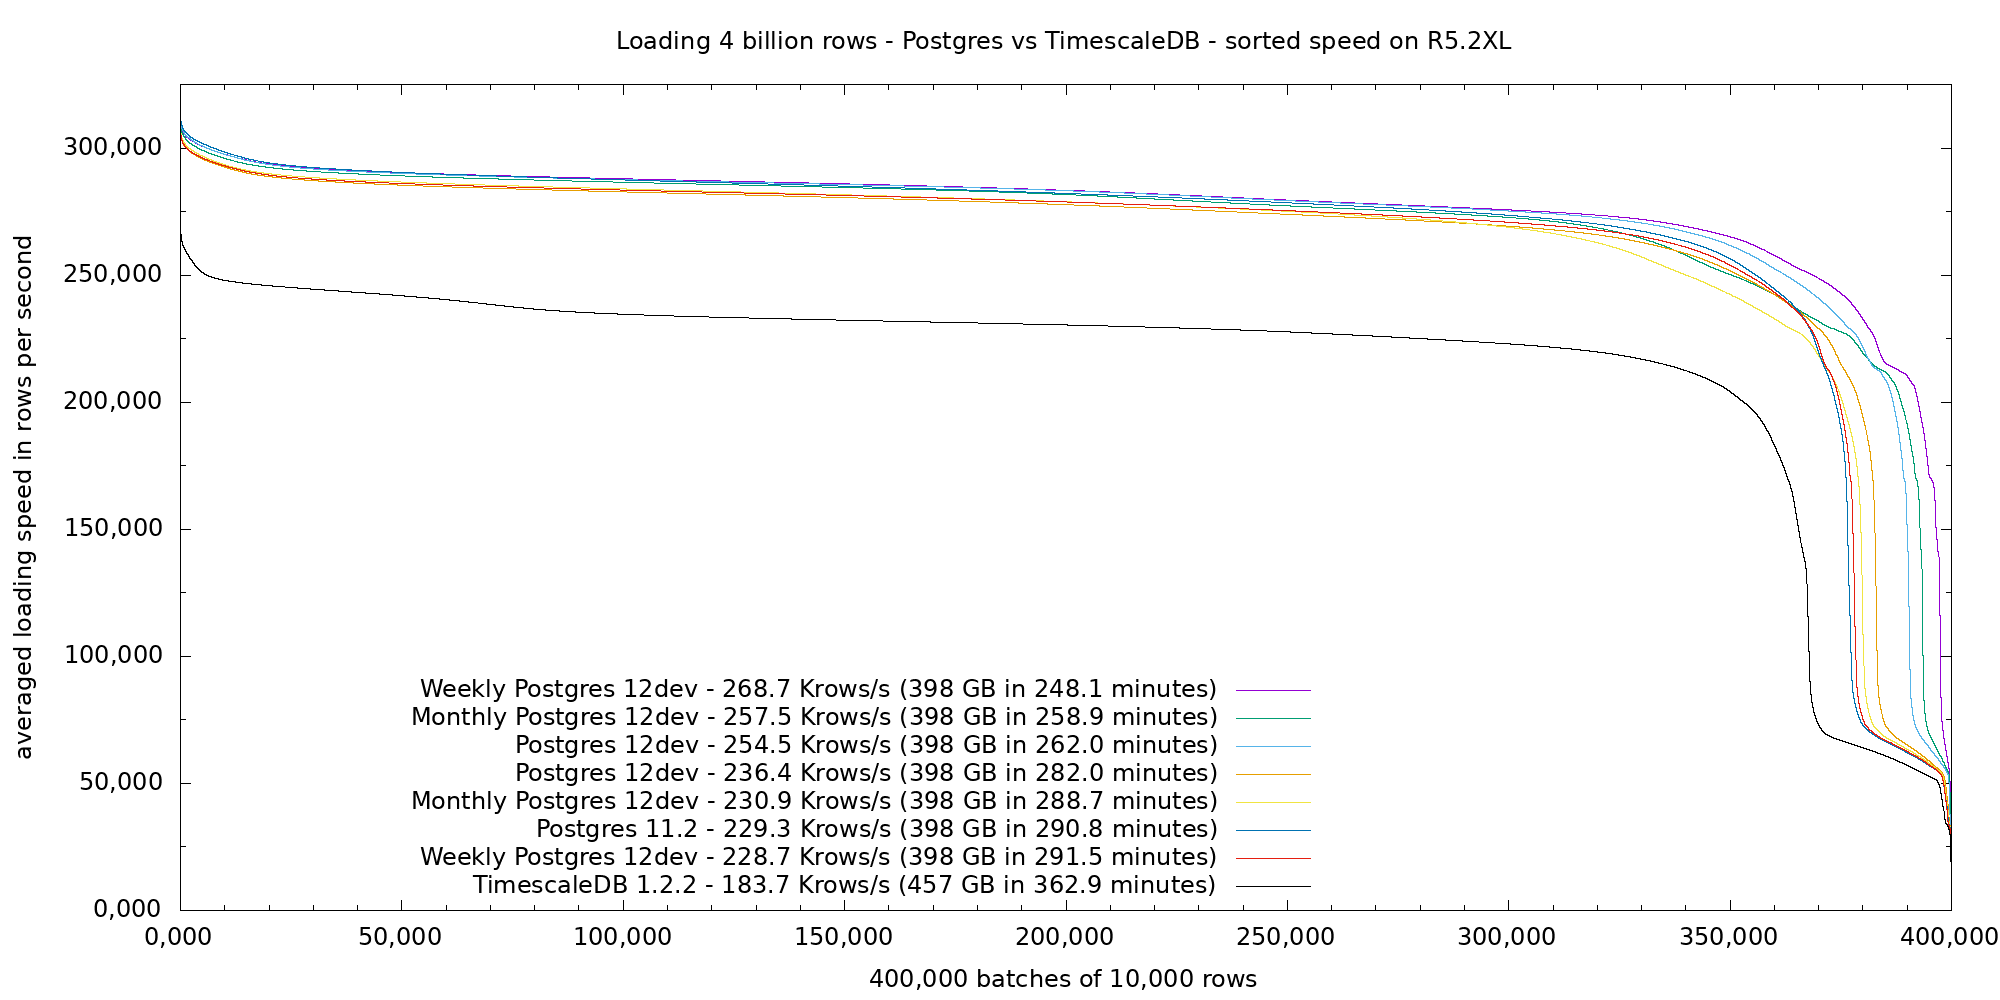
In order to get a (hopefully) clearer view, the next figure shows the sorted raw loading speed performance of all the presented runs.
We can clearly see the two main modes: one long hight speed flat line encompassing 92 to 99% of each run, and a dwidling low-performance performance for 8 to 1% of in the end, with most measures around 65 Krows/s. For the high speed part, all Postgres runs perform consistently at about 280 Krows/s. TimescaleDB run performs at 245 Krows/s, a 13% gap: this is about the storage gap, as Postgres has 15% less data to process and store, thus the performance is 18% better on this part. For the low speed part, I think that it is mostly related to index storage (page eviction and checkpoint) which interrupts the normal high speed flow. As the TimescaleDB index is 69% larger, more batches are concerned, this explain the larger low speed mode in the end and explains the further 10% performance gap. Then you can add some unrelated speed variations (we are on a VM with other processes running and doing IOs), which add +- 8% on our measures, and we have a global explanation for the figures.
Now, some depressing news: although the perl script was faster than loading (I
checked that fill.pl > /dev/null was running a little faster than when piped
to psql), the margin was small, and you have to take into account how piping
works, with processes interrupted and restarted based on the filling and
consumption of the intermediate buffer, so that it is possible that I was
running a partly data-generation CPU-bound test.
I rewrote the perl script in C and started again on a smaller box, which will give… better performance.
Second Tests on a C5.XL Instance
The second serie used a c5.xl CPU-optimized AWS instance (4 vCPU, 8 GiB), with the same volume attached. The rational for this choice is that I did not encounter any performance issue in the previous test when the index reached the memory size, so I did not really need a memory-enhanced instance in the first place, but I was possibly limited by CPU, so the faster the CPU the better.
Otherwise the installation followed the same procedure as described in the previous section, which resulted in updated versions (pg 11.3 et ts 1.3.0) and these configuration changes to adapt settings to the much smaller box:
shared_buffers = 1906MB
effective_cache_size = 5718MB
maintenance_work_mem = 976000kB
work_mem = 9760kB
max_worker_processes = 11
max_parallel_workers_per_gather = 2
max_parallel_workers = 4
max_locks_per_transaction = 64
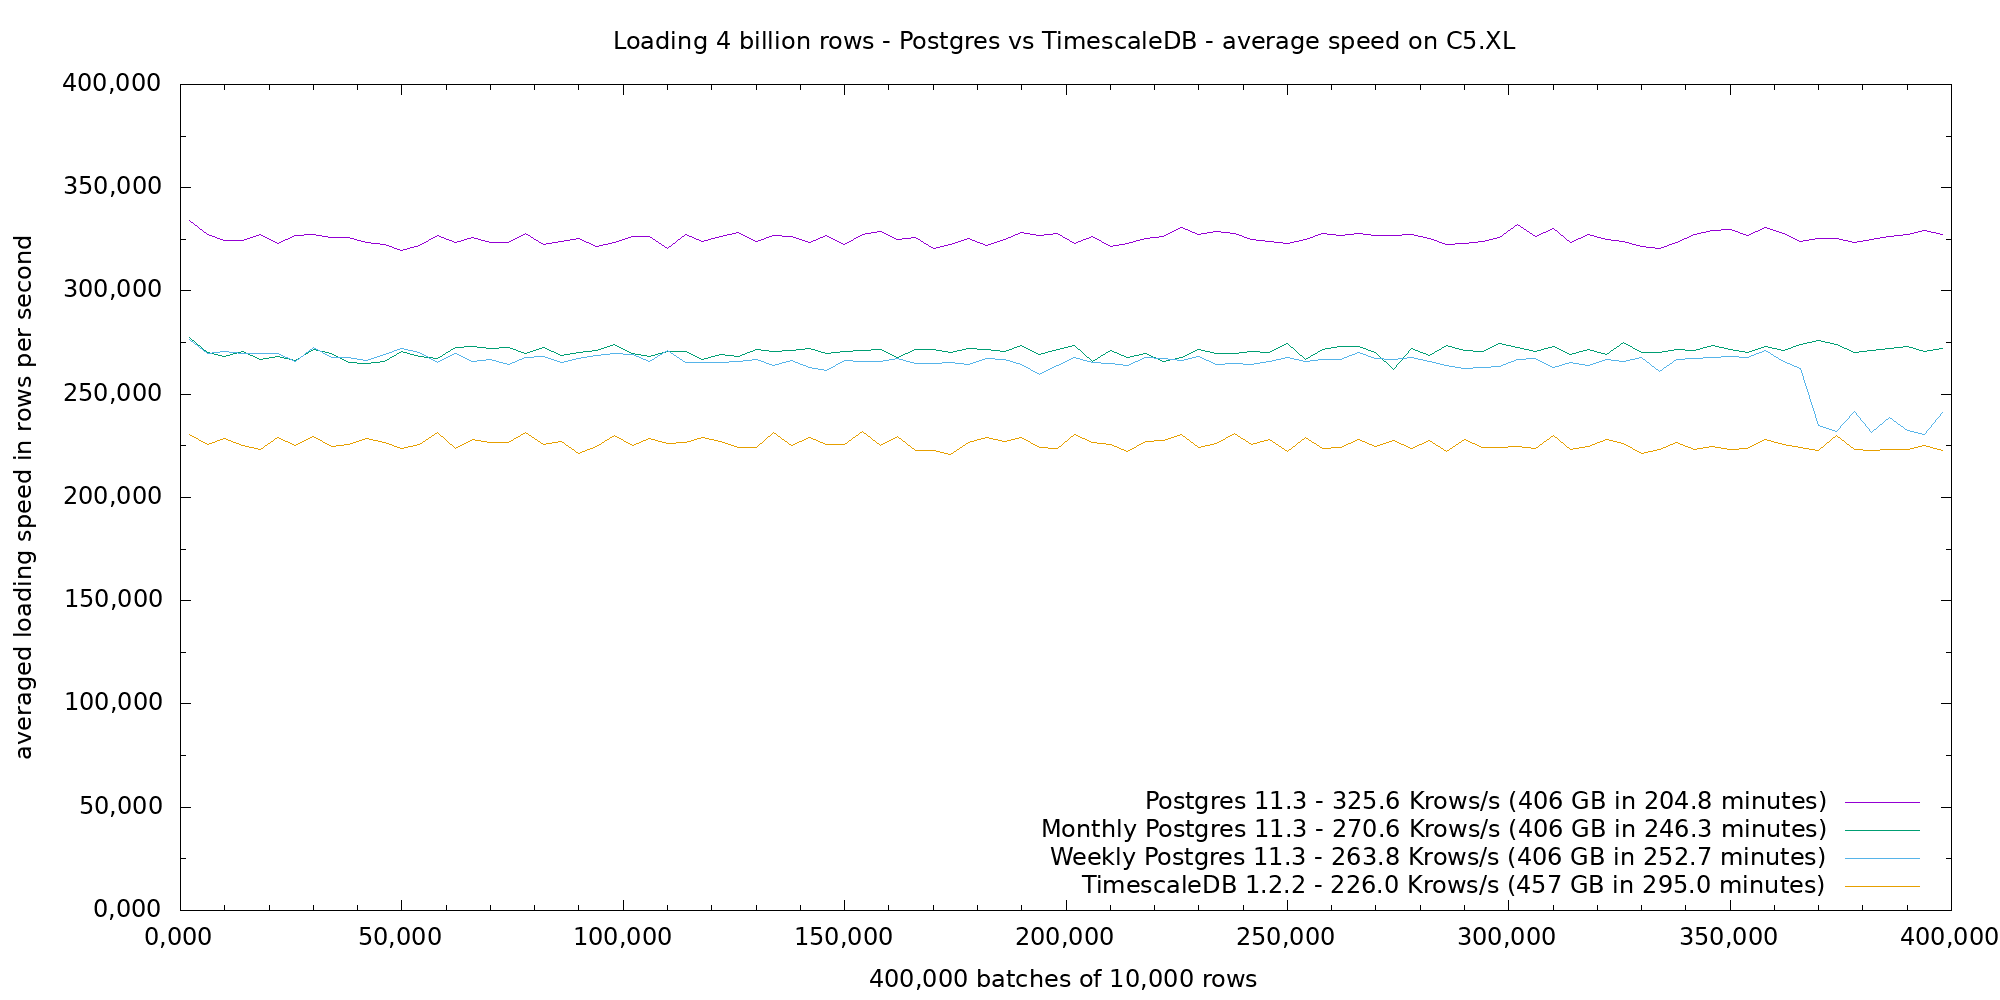
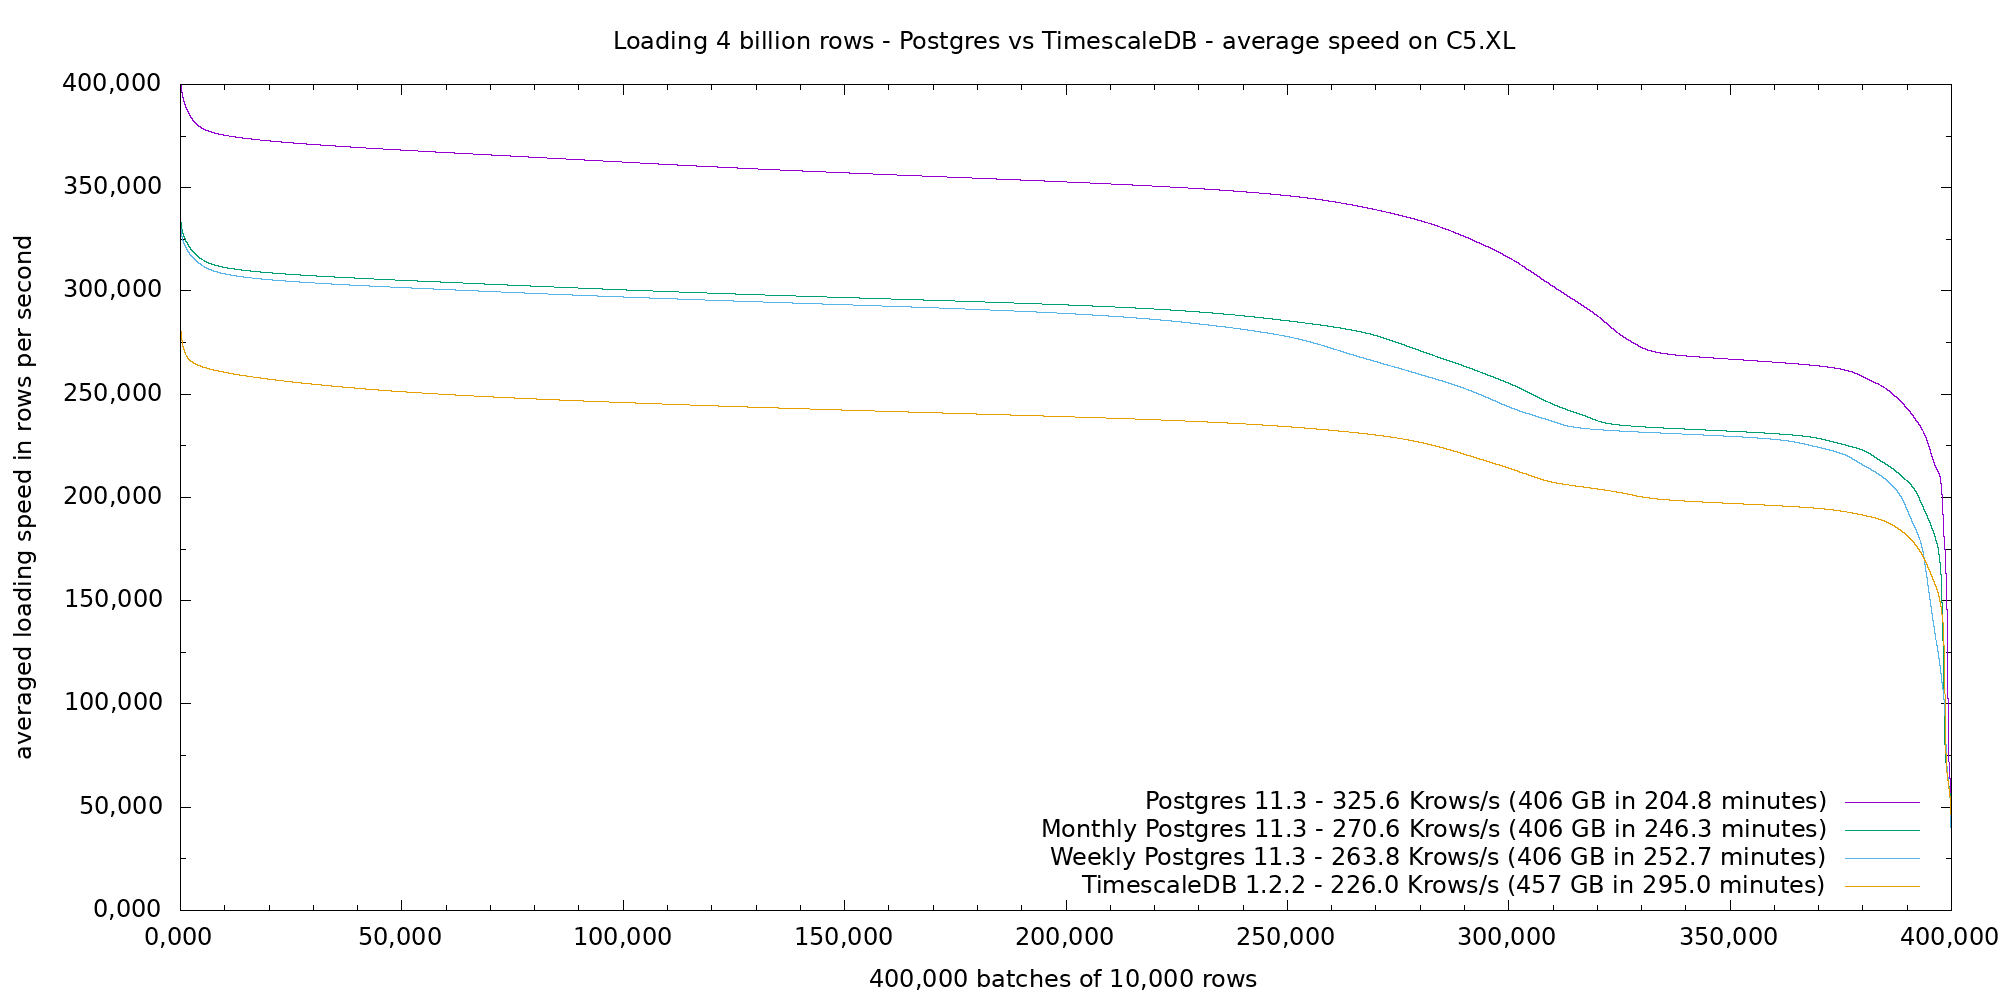
The next two figures shows average and sorted loading speed for 4 billion data on the C5.XL instance, with Postgres 11.3 and TimescaleDB 1.1.2. Postgres performance leads at 325 Krow/s, then both Postgres weekly and monthly partitioned tables around 265 Krows/s, then finally TimescaleDB which takes about 44% more time than Postgres at 226 Krows/s.
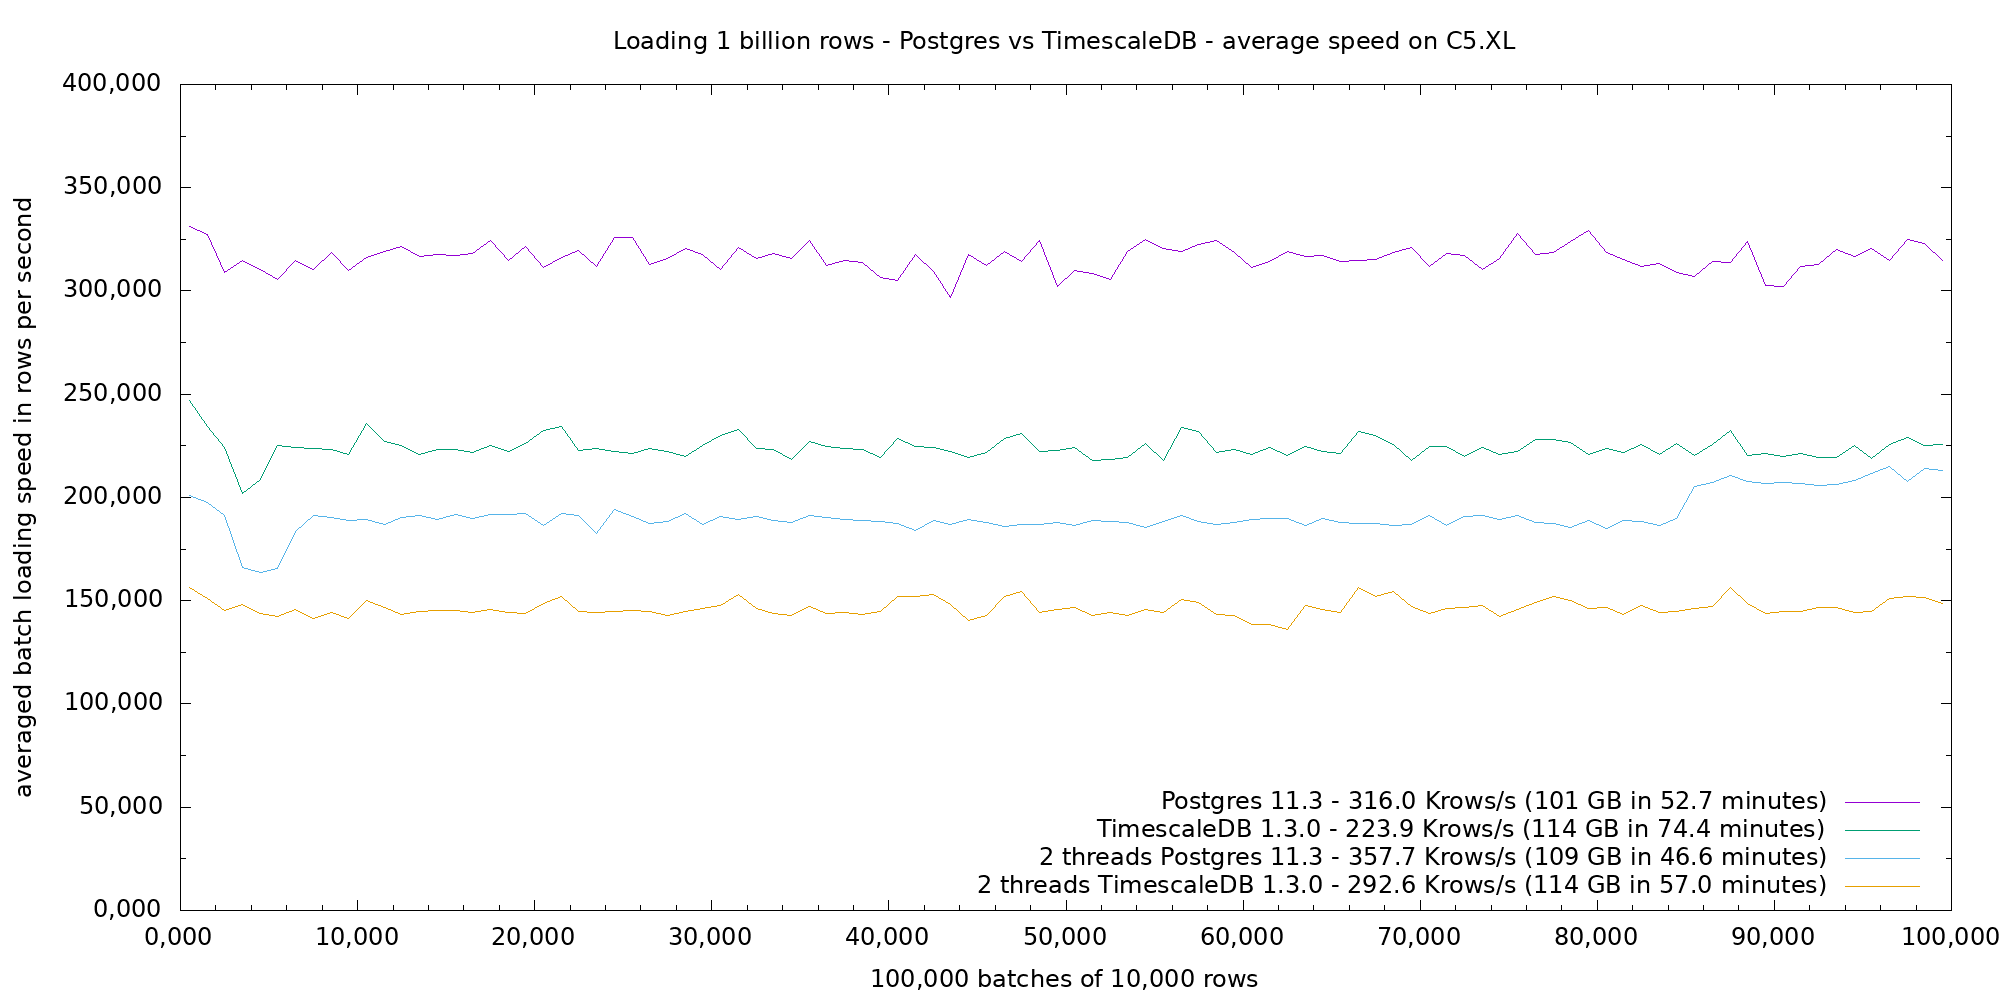
I implemented a threaded libpq-based generator, initially without and then with load balancing, which allows to load on several connections. The next figure shows the averaged loading performance with the psql-pipe approach compared to two threads, which gave the best overall performance on the 4 vCPU VM.
The upper lines show the loading speed of batches for Postgres vs TimescaleDB. The lower lines show the same with the two thread loading approach. Although the performance per batch is lower, two batches are running in parallel, hence the overall better performance. The end of Postgres parallel run shows a bump, which is due to the lack of load balancing of the version used in this run. It is interesting to note that Postgres incurs a size penalty, which is on the index, when the load is parallel.
Conclusion
It is the first time I ran a such precise data loading benchmark, trying to replicate results advertised in TimescaleDB documentation which shows Postgres loading performance degrading quickly.
I failed to achieve that: both tools perform consistently well, with Postgres v11 and v12 leading the way in raw loading performance, but also without the expected advantages of timeseries optimizations.
I’m used to run benches on bare metal, using a VM was a first. It is harder to interpret results because you do not really know what is going on, which is a pain.
See also: David Rowley blog about partitioning.

