Postgres FILLFACTOR for UPDATE
This post discusses the performance impact of Postgres FILLFACTOR table
storage parameter on an UPDATE OLTP load.
Note that this FILLFACTOR is indeed the table storage parameter, although
there is also an eponymous parameter for indexes.
How FILLFACTOR Impacts UPDATE Performance
By default, Postgres packs as many tuples as possible within a page, that is
FILLFACTOR=100 (percent).
When one UPDATE is performed, the old tuple is marked as deleted by the
current transaction (xmax hidden MVCC attribute), a new tuple is inserted in
another page (as the current page is full), and the indexes (at least the
primary key) is modified to point to the new page location.
This implies at least 3 page writes: the deleted-tuple page, the inserted-tuple
page and the index modifications.
However, if the page is not full, the new tuple can be inserted in the same page as the old tuple, and the index is still valid because it points to the right page, so it does not need to be modified (hopefully?). We are down to 1 random page write instead of about 3 (not counting WAL) in the previous full page case.
When many updates are occurring on a reasonably large base (we assume that concurrent updates hit distinct pages), it is not so simple: first, new-tuples being added will probably be stored together in a page, so the page writes for new tuples would be shared between concurrent updates. Second, as the index is much smaller, distinct updates are more likely to modify the same index pages, thus index page writes would also be shared. As actual page writes are delayed to checkpoints, more sharing may occur. So the performance improvement would be less than an optimistic 3 to 1.
Testing FILLFACTOR
In order to measure this effect, I ran a simple pgbench update custom script:
\set naccounts 100000 * :scale
\setrandom aid 1 :naccounts
\setrandom delta -5000 5000
BEGIN;
UPDATE pgbench_accounts
  SET abalance = abalance + :delta, filler = NOW()::TEXT
  WHERE aid = :aid;
END;
The standard setup is scaled to 100 with a shorter (30 instead of 84) filler
column.
The fill factor is either FILLFACTOR=100 or FILLFACTOR=95, set with
pgbench --fillfactor=... option.
The resulting table is 743 MB for the former fill factor, and 766 MB for the
later.
At it fits in memory, what is tested here is really random page writes on the
RAID5 HDD array.
The script is run for 2 hours by chunks of 200 seconds with something like:
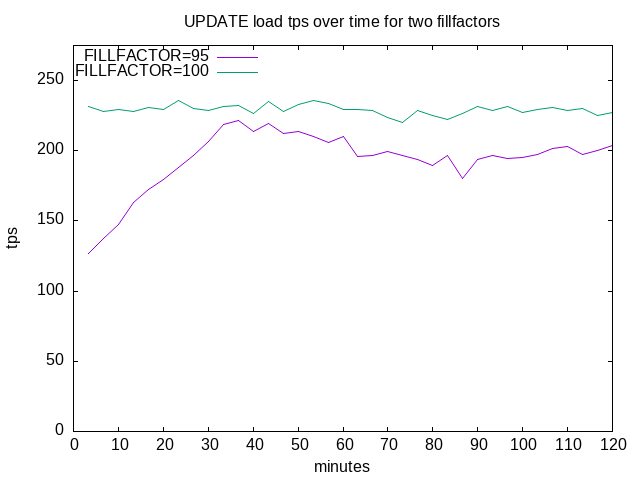
The results of the two runs are shown in this graph.
There are about 90,000 pages for storing the table with small tuples. Due to the overall disk performance, each 200-seconds run touches about 25-50% of pages depending on the tps.
For initially full pages (FILLFACTOR=100), the performance starts low and
increases slowly but steadily: once a page has been updated, there is now some
space available so that the next UPDATE in the same page should find local
space and thus performances benefit from it.
It peaks after 36 minutes, then performance decreases and then more or less
stabilizes around 200 tps.
My interpretation is that vacuum claims available space so more pages are
refilled, and thus get the lower multiple-page update performance.
With FILLFACTOR=95, the performance is both more stable and better at about
230 tps.
Conclusion
A relevant point is to assess the impact of diminishing FILLFACTOR by n% over
other operations:
Basically, all page-related performances should be reduced by about n% (probably
a little less, though) but for UPDATE.
Indeed, as there are less tuples per pages, the storage is expanded by about n%
(actually 3% for our n=5 tests above), the shared memory contains less tuples so
the hit ratio should be diminished by about n%, INSERT will require about n%
more pages, sequential read and write operations would access n% more pages,
and so on.
If you expect a significant UPDATE load on a particular table, do think of
adjusting the default table FILLFACTOR. If not, do not touch it!
Note that pgbench default load is 3 UPDATEs, 1 INSERT and 1 SELECT, I am
not sure how typical it is.
You can query monitoring statistics to check whether some of your tables could
benefit from a lower FILLFACTOR.
If you wish to repeat these tests with different settings, you can use the run script, custom bench and the extraction script.

